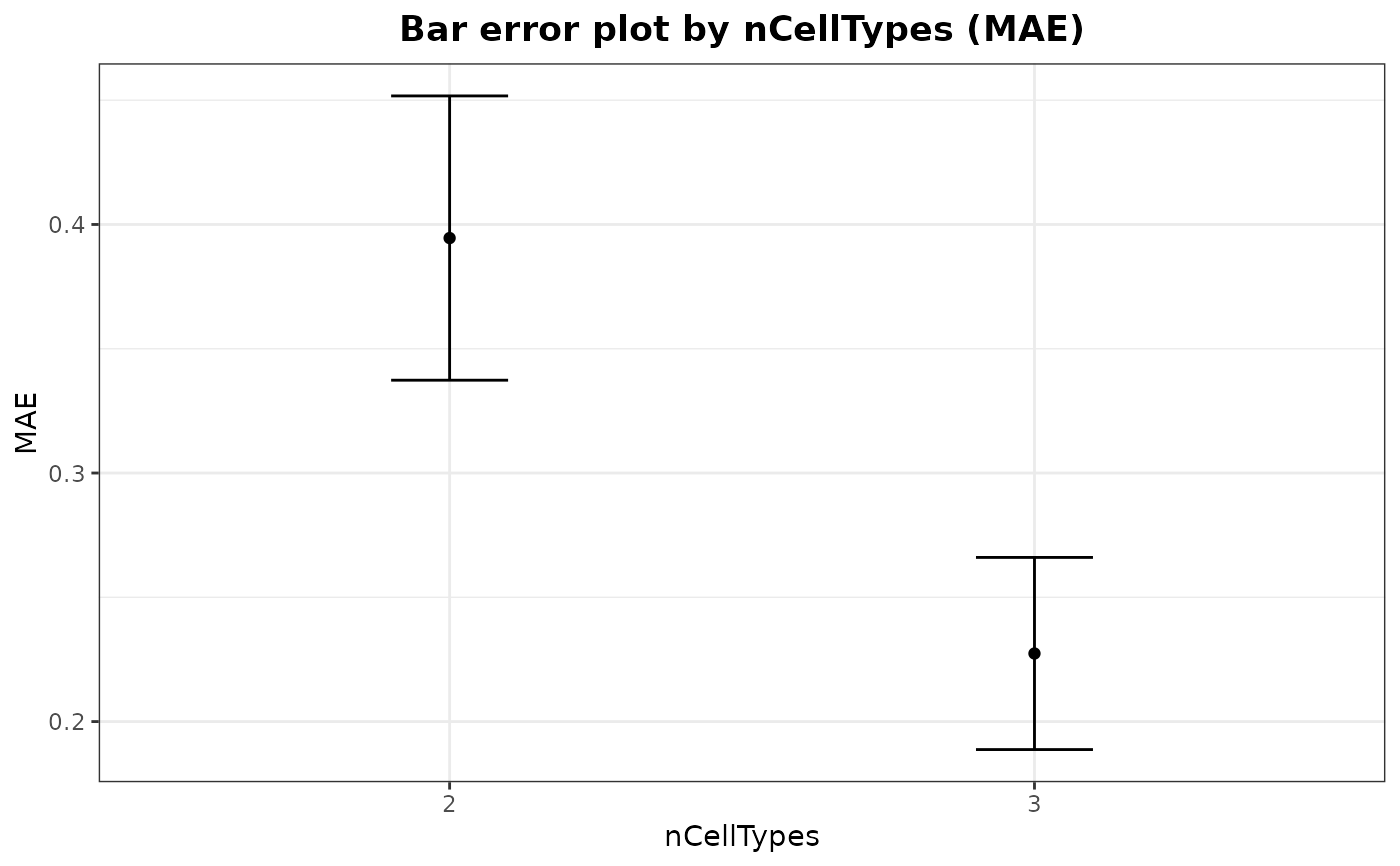
Generate bar error plots by cell type (CellType) or by number of
different cell types (nCellTypes) on test mixed transcriptional
profiles.
Usage
barErrorPlot(
  object,
  error = "MSE",
  by = "CellType",
  dispersion = "se",
  filter.sc = TRUE,
  title = NULL,
  angle = NULL,
  theme = NULL
)
Arguments
- object
SpatialDDLSobject withtrained.modelslot containing metrics in thetest.deconv.metricsslot of aDeconvDLModelobject.- error
'MAE'or'MSE'.- by
Variable used to show errors. Available options are:
'nCellTypes','CellType'.- dispersion
Standard error (
'se') or standard deviation ('sd'). The former by default.- filter.sc
Boolean indicating whether single-cell profiles are filtered out and only correlation of results associated with mixed transcriptional profiles are shown (
TRUEby default).- title
Title of the plot.
- angle
Angle of ticks.
- theme
ggplot2 theme.
Examples
# \donttest{
set.seed(123)
sce <- SingleCellExperiment::SingleCellExperiment(
assays = list(
counts = matrix(
rpois(30, lambda = 5), nrow = 15, ncol = 20,
dimnames = list(paste0("Gene", seq(15)), paste0("RHC", seq(20)))
)
),
colData = data.frame(
Cell_ID = paste0("RHC", seq(20)),
Cell_Type = sample(x = paste0("CellType", seq(6)), size = 20,
replace = TRUE)
),
rowData = data.frame(
Gene_ID = paste0("Gene", seq(15))
)
)
SDDLS <- createSpatialDDLSobject(
sc.data = sce,
sc.cell.ID.column = "Cell_ID",
sc.gene.ID.column = "Gene_ID",
sc.filt.genes.cluster = FALSE
)
#> === Spatial transcriptomics data not provided
#> === Processing single-cell data
#> 'as(<dgCMatrix>, "dgTMatrix")' is deprecated.
#> Use 'as(., "TsparseMatrix")' instead.
#> See help("Deprecated") and help("Matrix-deprecated").
#> - Filtering features:
#> - Selected features: 15
#> - Discarded features: 0
#>
#> === No mitochondrial genes were found by using ^mt- as regrex
#>
#> === Final number of dimensions for further analyses: 15
SDDLS <- genMixedCellProp(
object = SDDLS,
cell.ID.column = "Cell_ID",
cell.type.column = "Cell_Type",
num.sim.spots = 100,
train.freq.cells = 2/3,
train.freq.spots = 2/3,
verbose = TRUE
)
#>
#> === The number of mixed profiles that will be generated is equal to 100
#>
#> === Training set cells by type:
#> - CellType1: 3
#> - CellType2: 1
#> - CellType3: 3
#> - CellType4: 2
#> - CellType5: 3
#> - CellType6: 2
#> === Test set cells by type:
#> - CellType1: 1
#> - CellType2: 1
#> - CellType3: 1
#> - CellType4: 1
#> - CellType5: 1
#> - CellType6: 1
#> === Probability matrix for training data:
#> - Mixed spots: 67
#> - Cell types: 6
#> === Probability matrix for test data:
#> - Mixed spots: 33
#> - Cell types: 6
#> DONE
SDDLS <- simMixedProfiles(SDDLS)
#> === Setting parallel environment to 1 thread(s)
#>
#> === Generating train mixed profiles:
#>
#> === Generating test mixed profiles:
#>
#> DONE
# training of DDLS model
SDDLS <- trainDeconvModel(
object = SDDLS,
batch.size = 10,
num.epochs = 5
)
#> === Training and test from stored data
#> Using only simulated mixed samples
#> Using only simulated mixed samples
#> Model: "SpatialDDLS"
#> _____________________________________________________________________
#> Layer (type) Output Shape Param #
#> =====================================================================
#> Dense1 (Dense) (None, 200) 3200
#> _____________________________________________________________________
#> BatchNormalization1 (BatchNorm (None, 200) 800
#> _____________________________________________________________________
#> Activation1 (Activation) (None, 200) 0
#> _____________________________________________________________________
#> Dropout1 (Dropout) (None, 200) 0
#> _____________________________________________________________________
#> Dense2 (Dense) (None, 200) 40200
#> _____________________________________________________________________
#> BatchNormalization2 (BatchNorm (None, 200) 800
#> _____________________________________________________________________
#> Activation2 (Activation) (None, 200) 0
#> _____________________________________________________________________
#> Dropout2 (Dropout) (None, 200) 0
#> _____________________________________________________________________
#> Dense3 (Dense) (None, 6) 1206
#> _____________________________________________________________________
#> BatchNormalization3 (BatchNorm (None, 6) 24
#> _____________________________________________________________________
#> ActivationSoftmax (Activation) (None, 6) 0
#> =====================================================================
#> Total params: 46,230
#> Trainable params: 45,418
#> Non-trainable params: 812
#> _____________________________________________________________________
#>
#> === Training DNN with 67 samples:
#>
#> === Evaluating DNN in test data (33 samples)
#> - loss: 1.6731
#> - accuracy: 0.1515
#> - mean_absolute_error: 0.2434
#> - categorical_accuracy: 0.1515
#>
#> === Generating prediction results using test data
#> DONE
# evaluation using test data
SDDLS <- calculateEvalMetrics(object = SDDLS)
# bar error plots
barErrorPlot(
object = SDDLS,
error = "MSE",
by = "CellType"
)
 barErrorPlot(
object = SDDLS,
error = "MAE",
by = "nCellTypes"
)
barErrorPlot(
object = SDDLS,
error = "MAE",
by = "nCellTypes"
)
 # }
# }