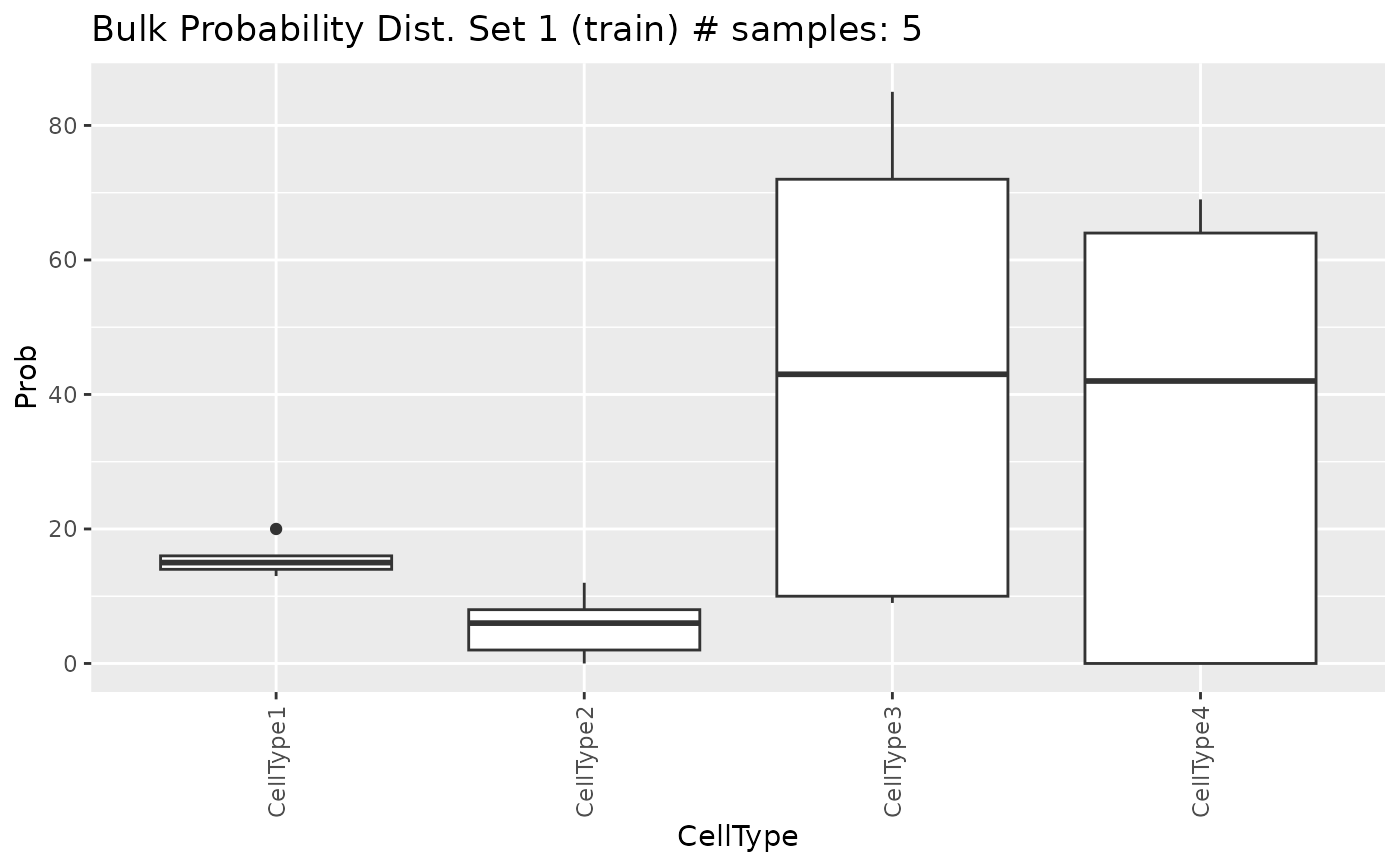
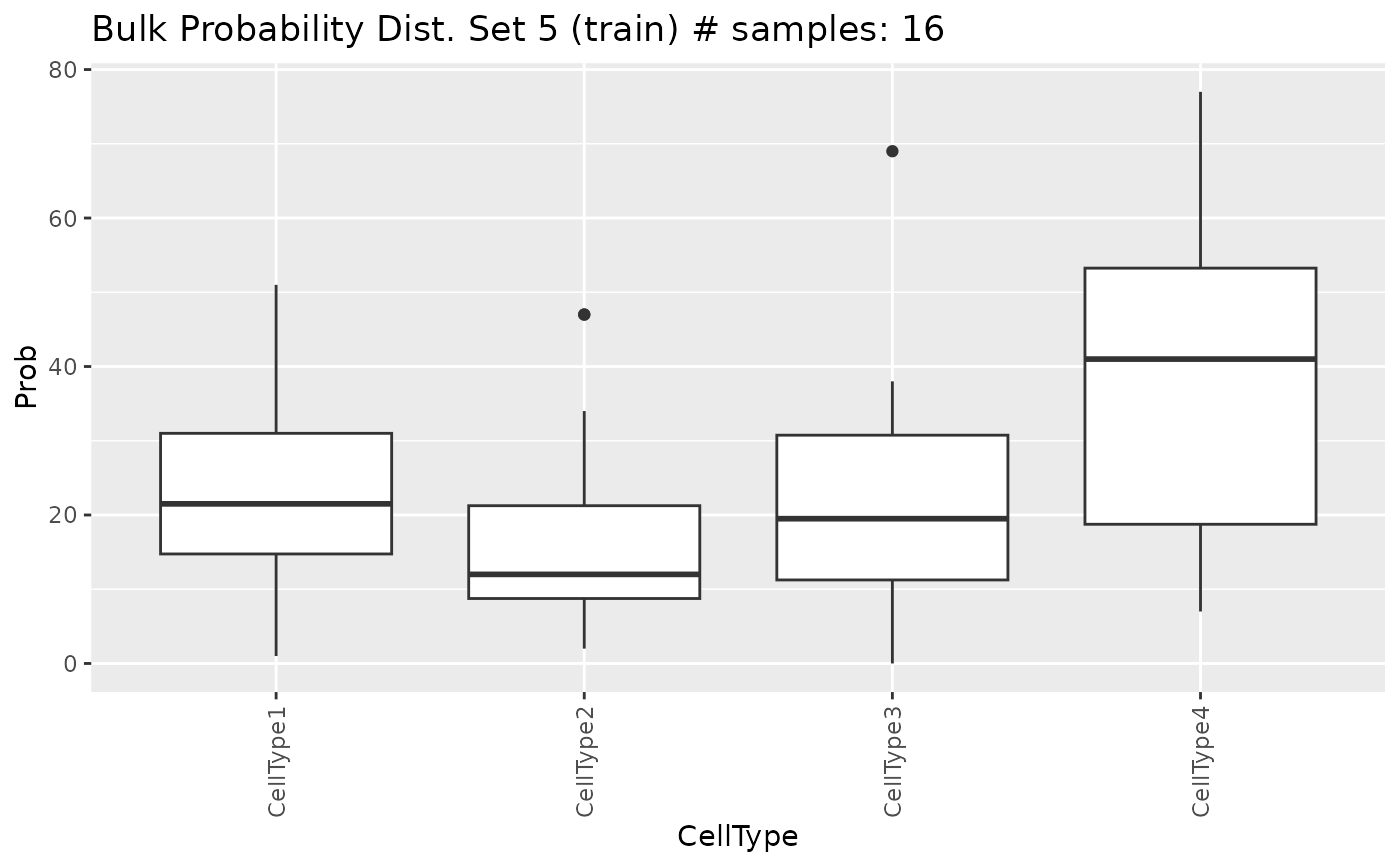
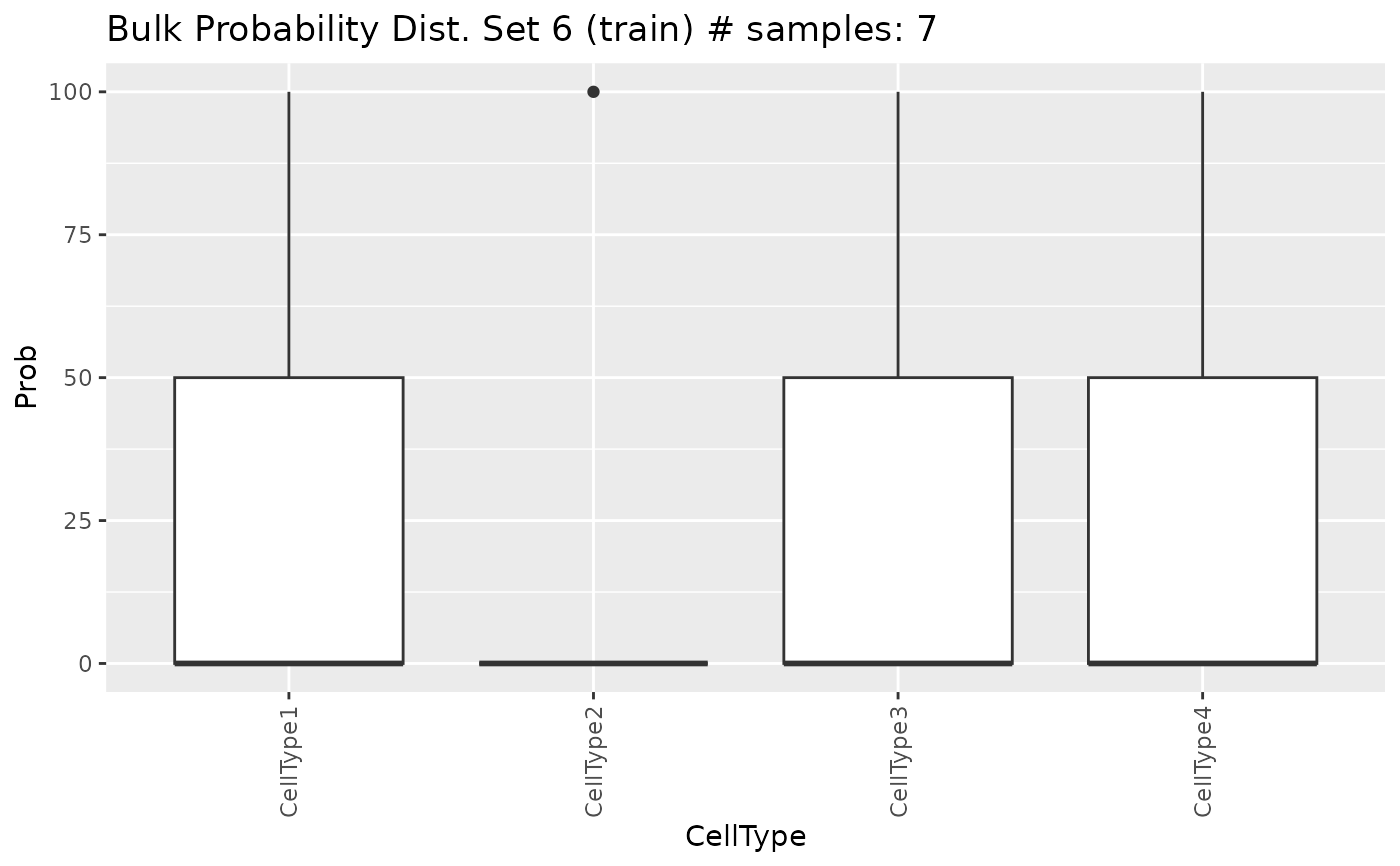
Show distribution plots of the cell proportions generated by generateBulkCellMatrix
Source: R/utils.R
showProbPlot.RdShow distribution plots of the cell proportions generated by
generateBulkCellMatrix. These frequencies will determine the
proportion of different cell types used during the simulation of pseudo-bulk
RNA-Seq samples. There are 6 subsets of proportions generated by different
approaches that can be visualized in three ways: box plots, violin plots and
lines plots. You can also plot the probabilities based on the number of
different cell types present in the samples by setting type.plot =
'nCellTypes'.
showProbPlot(object, type.data, set, type.plot = "boxplot")Arguments
- object
DigitalDLSorterobject withprob.cell.typesslot withplotslot.- type.data
Subset of data to show:
trainortest.- set
Integer determining which of the 6 different subsets to display.
- type.plot
Character determining which type of visualization to display. It can be
'boxplot','violinplot','linesplot'or'ncelltypes'. See Description for more information.
Value
A ggplot object.
Details
These plots are only for diagnostic purposes. This is the reason because they are generated without any parameter introduced by the user.
See also
Examples
# simulating data
set.seed(123) # reproducibility
sce <- SingleCellExperiment::SingleCellExperiment(
assays = list(
counts = matrix(
rpois(100, lambda = 5), nrow = 40, ncol = 30,
dimnames = list(paste0("Gene", seq(40)), paste0("RHC", seq(30)))
)
),
colData = data.frame(
Cell_ID = paste0("RHC", seq(30)),
Cell_Type = sample(x = paste0("CellType", seq(4)), size = 30,
replace = TRUE)
),
rowData = data.frame(
Gene_ID = paste0("Gene", seq(40))
)
)
DDLS <- createDDLSobject(
sc.data = sce,
sc.cell.ID.column = "Cell_ID",
sc.gene.ID.column = "Gene_ID",
sc.filt.genes.cluster = FALSE,
sc.log.FC = FALSE
)
#> === Bulk RNA-seq data not provided
#> === Processing single-cell data
#> - Filtering features:
#> - Selected features: 40
#> - Discarded features: 0
#>
#> === No mitochondrial genes were found by using ^mt- as regrex
#>
#> === Final number of dimensions for further analyses: 40
probMatrix <- data.frame(
Cell_Type = paste0("CellType", seq(4)),
from = c(1, 1, 1, 30),
to = c(15, 15, 50, 70)
)
DDLS <- generateBulkCellMatrix(
object = DDLS,
cell.ID.column = "Cell_ID",
cell.type.column = "Cell_Type",
prob.design = probMatrix,
num.bulk.samples = 60
)
#>
#> === The number of bulk RNA-Seq samples that will be generated is equal to 60
#>
#> === Training set cells by type:
#> - CellType1: 5
#> - CellType2: 6
#> - CellType3: 6
#> - CellType4: 5
#> === Test set cells by type:
#> - CellType1: 2
#> - CellType2: 2
#> - CellType3: 2
#> - CellType4: 2
#> === Probability matrix for training data:
#> - Bulk RNA-Seq samples: 45
#> - Cell types: 4
#> === Probability matrix for test data:
#> - Bulk RNA-Seq samples: 15
#> - Cell types: 4
#> DONE
lapply(
X = 1:6, FUN = function(x) {
showProbPlot(
DDLS,
type.data = "train",
set = x,
type.plot = "boxplot"
)
}
)
#> [[1]]
 #>
#> [[2]]
#>
#> [[2]]
 #>
#> [[3]]
#>
#> [[3]]
 #>
#> [[4]]
#>
#> [[4]]
 #>
#> [[5]]
#>
#> [[5]]
 #>
#> [[6]]
#>
#> [[6]]
 #>
#>