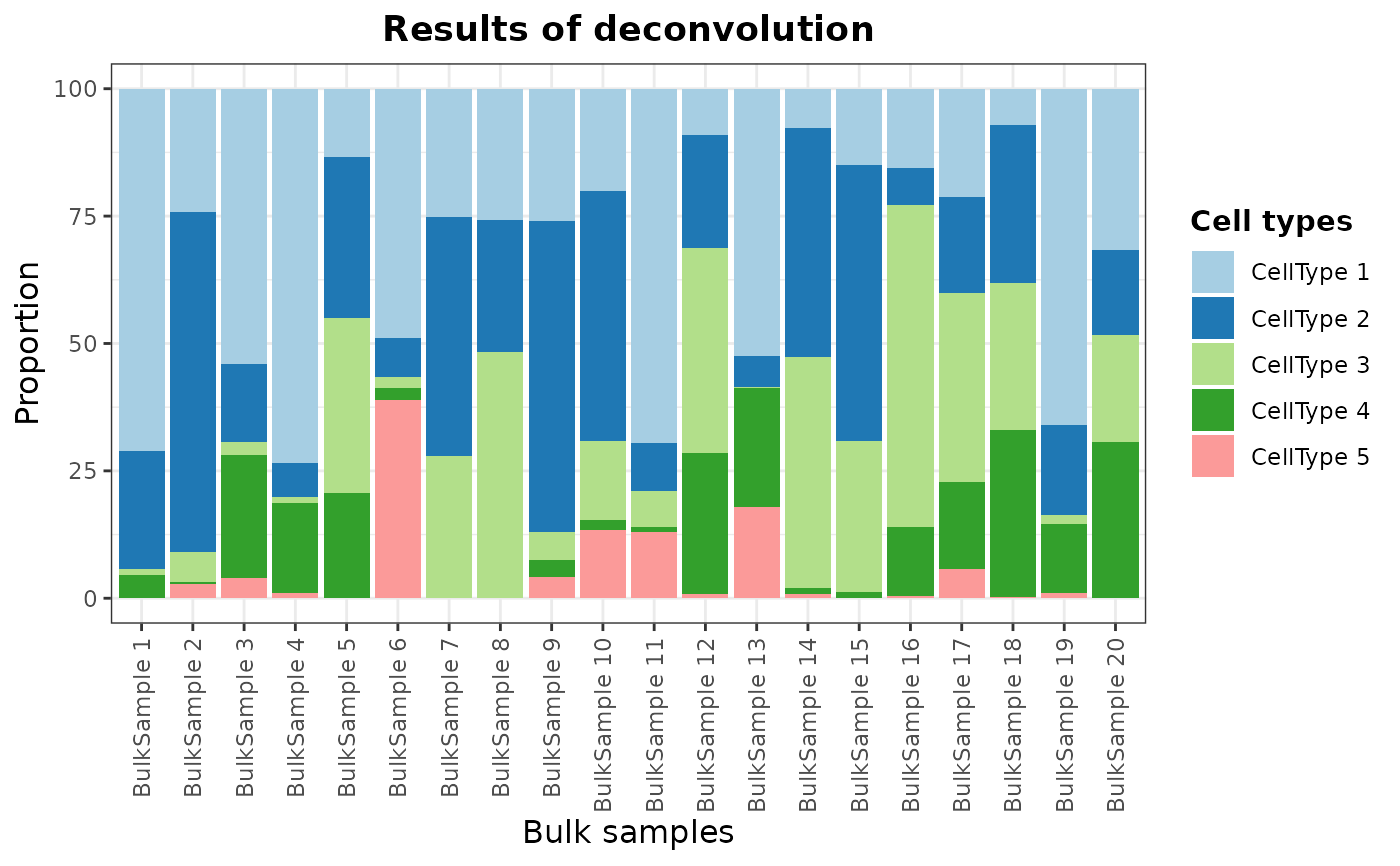
Bar plot of deconvoluted cell type proportions in bulk RNA-Seq samples
Source:R/AllGenerics.R
barPlotCellTypes.RdBar plot of deconvoluted cell type proportions in bulk RNA-Seq samples.
barPlotCellTypes(
  data,
  colors = NULL,
  simplify = NULL,
  color.line = NA,
  x.label = "Bulk samples",
  rm.x.text = FALSE,
  title = "Results of deconvolution",
  legend.title = "Cell types",
  angle = 90,
  theme = NULL,
  ...
)

# S4 method for class 'DigitalDLSorter'
barPlotCellTypes(
  data,
  colors = NULL,
  simplify = NULL,
  color.line = NA,
  x.label = "Bulk samples",
  rm.x.text = FALSE,
  title = "Results of deconvolution",
  legend.title = "Cell types",
  angle = 90,
  theme = NULL,
  name.data = NULL
)

# S4 method for class 'ANY'
barPlotCellTypes(
  data,
  colors,
  color.line = NA,
  x.label = "Bulk samples",
  rm.x.text = FALSE,
  title = "Results of deconvolution",
  legend.title = "Cell types",
  angle = 90,
  theme = NULL
)
Arguments
- data
DigitalDLSorterobject withdeconv.resultsslot or a data frame/matrix with cell types as columns and samples as rows.- colors
Vector of colors to be used.
- simplify
Type of simplification performed during deconvolution. Can be
simpli.setorsimpli.maj(NULLby default). It is only forDigitalDLSorterobjects.- color.line
Color of the border bars.
- x.label
Label of x-axis.
- rm.x.text
Logical value indicating whether to remove x-axis ticks (name of samples).
- title
Title of the plot.
- legend.title
Title of the legend plot.
- angle
Angle of text ticks.
- theme
ggplot2 theme.
- ...
Other arguments for specific methods.
- name.data
If a
DigitalDLSorteris given, name of the element that stores the results in thedeconv.resultsslot.
Value
A ggplot object with the provided cell proportions represented as a bar plot.
See also
Examples
# matrix of simulated proportions (same estructure as deconvolution results)
deconvResults <- gtools::rdirichlet(n = 20, alpha = c(1, 1, 1, 0.5, 0.1))
colnames(deconvResults) <- paste("CellType", seq(ncol(deconvResults)))
rownames(deconvResults) <- paste("BulkSample", seq(nrow(deconvResults)))
barPlotCellTypes(deconvResults)


# Using a DigitalDLSorter object
DDLS <- DigitalDLSorter(deconv.results = list(Example = deconvResults))
barPlotCellTypes(DDLS)
#> 'name.data' not provided. By default, first results are used
# Using a DigitalDLSorter object
DDLS <- DigitalDLSorter(deconv.results = list(Example = deconvResults))
barPlotCellTypes(DDLS)
#> 'name.data' not provided. By default, first results are used
