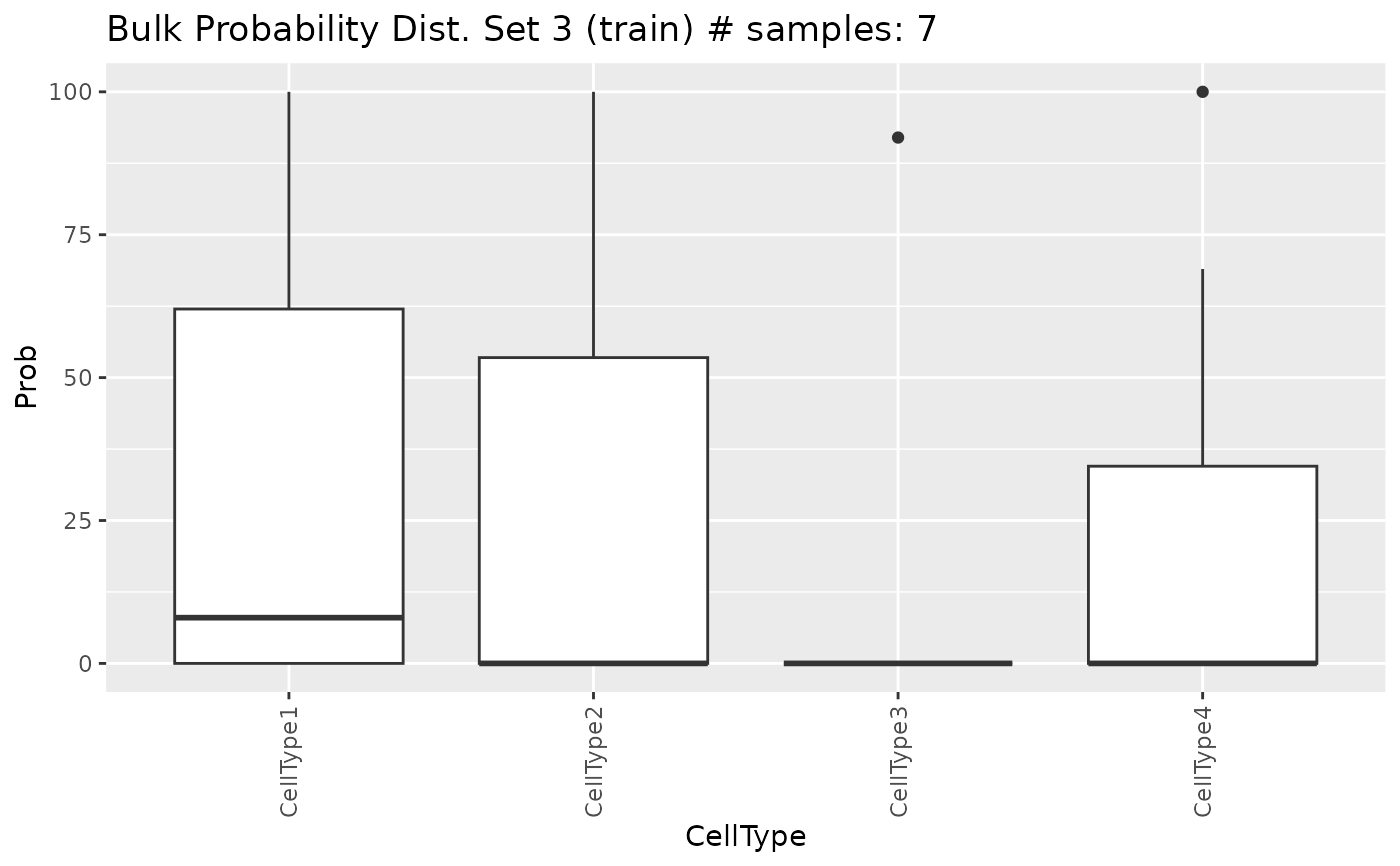
Show distribution plots of the cell proportions generated by
genMixedCellProp
Source: R/utils.R
showProbPlot.RdShow distribution plots of the cell proportions generated by the
genMixedCellProp function.
Arguments
- object
SpatialDDLSobject withprob.cell.typesslot withplotslot.- type.data
Subset of data to show:
trainortest.- set
Integer determining which of the 6 different subsets to display.
- type.plot
Character determining which type of visualization to display. It can be
'boxplot','violinplot','linesplot'or'ncelltypes'. See Description for more information.
Details
These frequencies will determine the proportion of different cell types used
during the simulation of mixed transcriptional profiles. Proportions
generated by each method (see ?genMixedCellProp) can be
visualized in three ways: box plots, violin plots, and lines plots. You can
also plot the probabilities based on the number of different cell types
present in the samples by setting type.plot = 'nCellTypes'.
Examples
set.seed(123)
sce <- SingleCellExperiment::SingleCellExperiment(
  assays = list(
    counts = matrix(
      rpois(100, lambda = 5), nrow = 40, ncol = 30,
      dimnames = list(paste0("Gene", seq(40)), paste0("RHC", seq(30)))
    )
  ),
  colData = data.frame(
    Cell_ID = paste0("RHC", seq(30)),
    Cell_Type = sample(x = paste0("CellType", seq(4)), size = 30,
                       replace = TRUE)
  ),
  rowData = data.frame(
    Gene_ID = paste0("Gene", seq(40))
  )
)

SDDLS <- createSpatialDDLSobject(
  sc.data = sce,
  sc.cell.ID.column = "Cell_ID",
  sc.gene.ID.column = "Gene_ID",
  project = "Simul_example",
  sc.filt.genes.cluster = FALSE
)
#> === Spatial transcriptomics data not provided
#> === Processing single-cell data
#>       - Filtering features:
#>          - Selected features: 40
#>          - Discarded features: 0
#>
#> === No mitochondrial genes were found by using ^mt- as regrex
#>
#> === Final number of dimensions for further analyses: 40
SDDLS <- genMixedCellProp(
  object = SDDLS,
  cell.ID.column = "Cell_ID",
  cell.type.column = "Cell_Type",
  num.sim.spots = 10,
  train.freq.cells = 2/3,
  train.freq.spots = 2/3,
  verbose = TRUE
)
#>
#> === The number of mixed profiles that will be generated is equal to 10
#>
#> === Training set cells by type:
#>     - CellType1: 5
#>     - CellType2: 5
#>     - CellType3: 5
#>     - CellType4: 5
#> === Test set cells by type:
#>     - CellType1: 2
#>     - CellType2: 3
#>     - CellType3: 3
#>     - CellType4: 2
#> === Probability matrix for training data:
#>     - Mixed spots: 7
#>     - Cell types: 4
#> === Probability matrix for test data:
#>     - Mixed spots: 3
#>     - Cell types: 4
#> DONE
showProbPlot(
   SDDLS,
   type.data = "train",
   set = 1,
   type.plot = "boxplot"
 )